ProactiveDB
Krizars' proprietary database monitoring tool that provides real-time insights, smart alerting, and proactive performance management across all major database platforms.
Monitor Everything, Miss Nothing
ProactiveDB is built by DBAs, for DBAs. It provides deep visibility into your database environment with intelligent monitoring that goes beyond simple uptime checks. Our tool correlates metrics across your entire stack to identify root causes before they impact your business.
With ProactiveDB, you get a single pane of glass to monitor Oracle, SQL Server, MySQL, and PostgreSQL databases — whether they're on-premise, in the cloud, or hybrid.
Request a Demo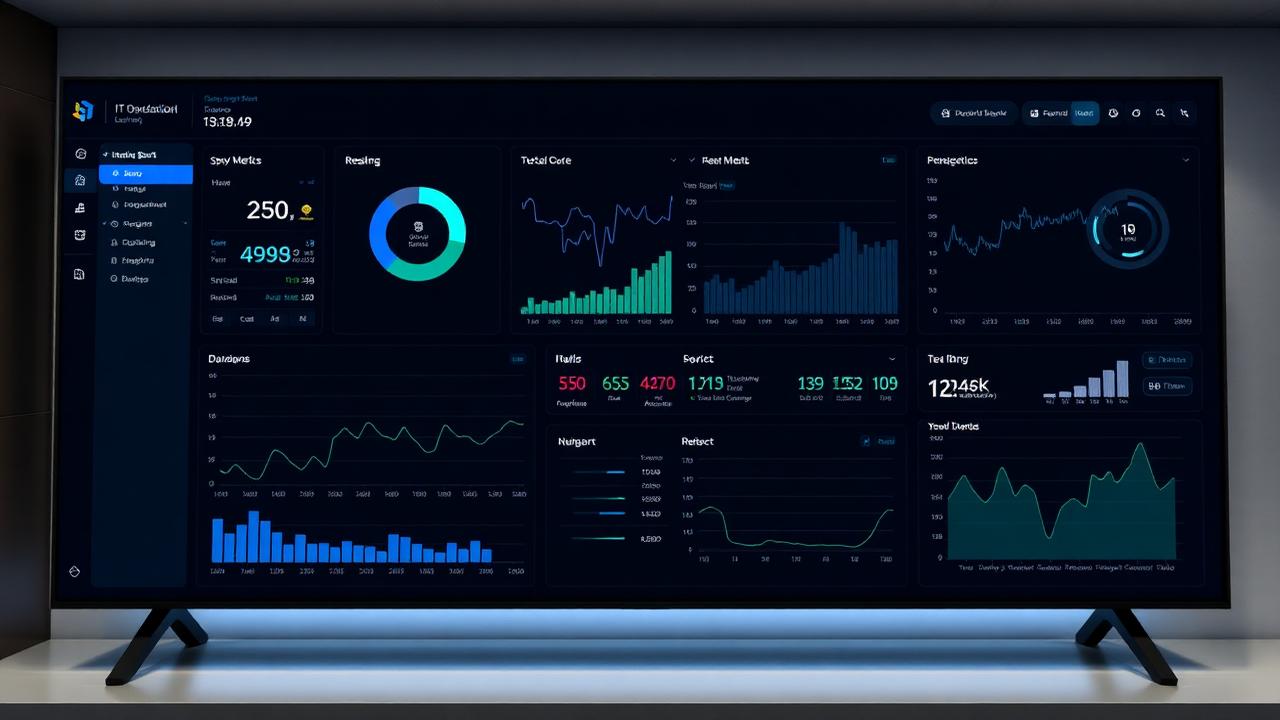
Key Features
Real-Time Monitoring
Track database performance metrics in real-time with customizable dashboards and threshold-based alerts.
Smart Alerting
Intelligent alerts with escalation policies, reducing noise and highlighting critical issues.
Performance Analytics
Deep-dive analytics for query performance, wait events, I/O stats, and resource utilization.
Security Monitoring
Track login attempts, privilege changes, and audit compliance in real-time.
Resource Optimization
CPU, memory, disk, and network utilization tracking with capacity forecasting.
Multi-Platform Support
Monitor Oracle, SQL Server, MySQL, and PostgreSQL from a single unified dashboard.
Platform Highlights
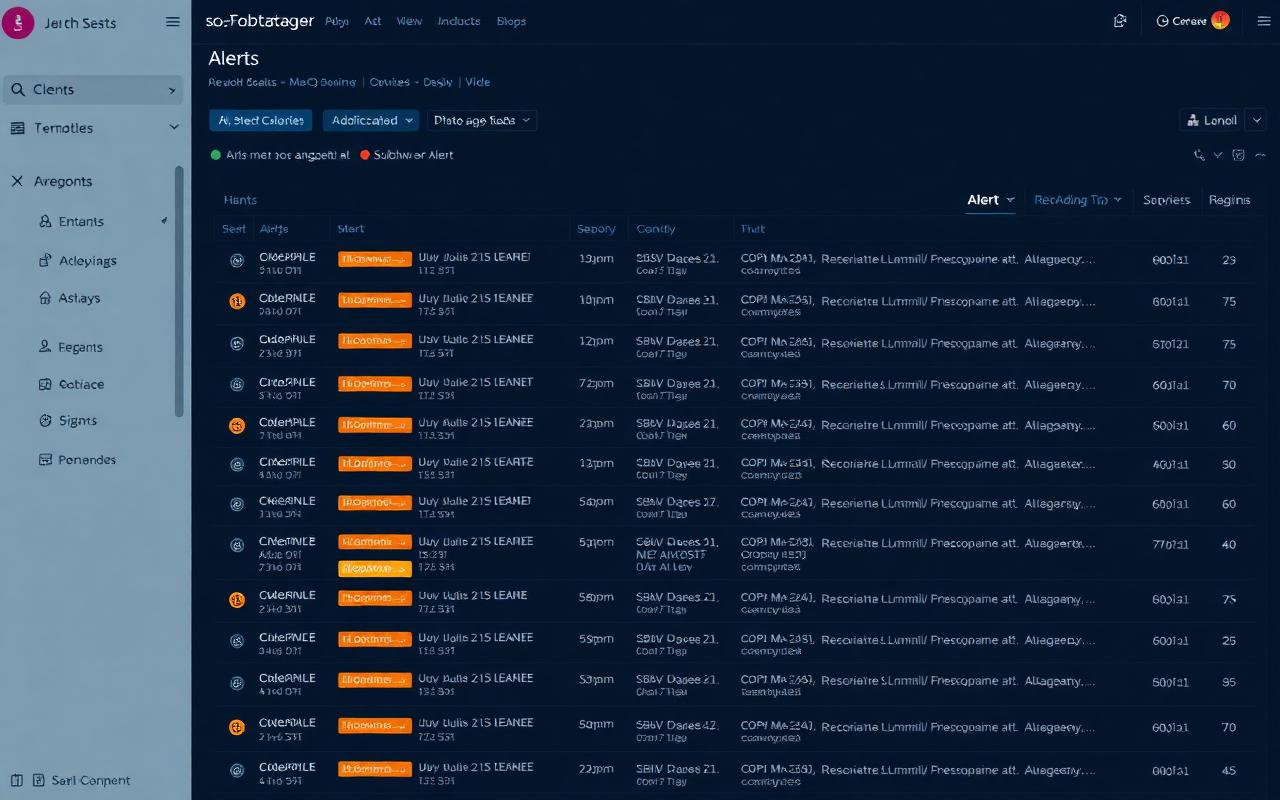
Smart Alerting
Catch Incidents Before Users Do
ProactiveDB combines static thresholds with dynamic baselines to surface only the alerts that matter. Noisy false positives are suppressed, related events are grouped, and severity is auto-assigned based on business impact.
- Multi-channel delivery: Slack, Teams, PagerDuty, email, SMS, webhooks
- On-call schedules with automatic escalation paths
- Maintenance windows & alert suppression rules
- Anomaly detection powered by historical baselines
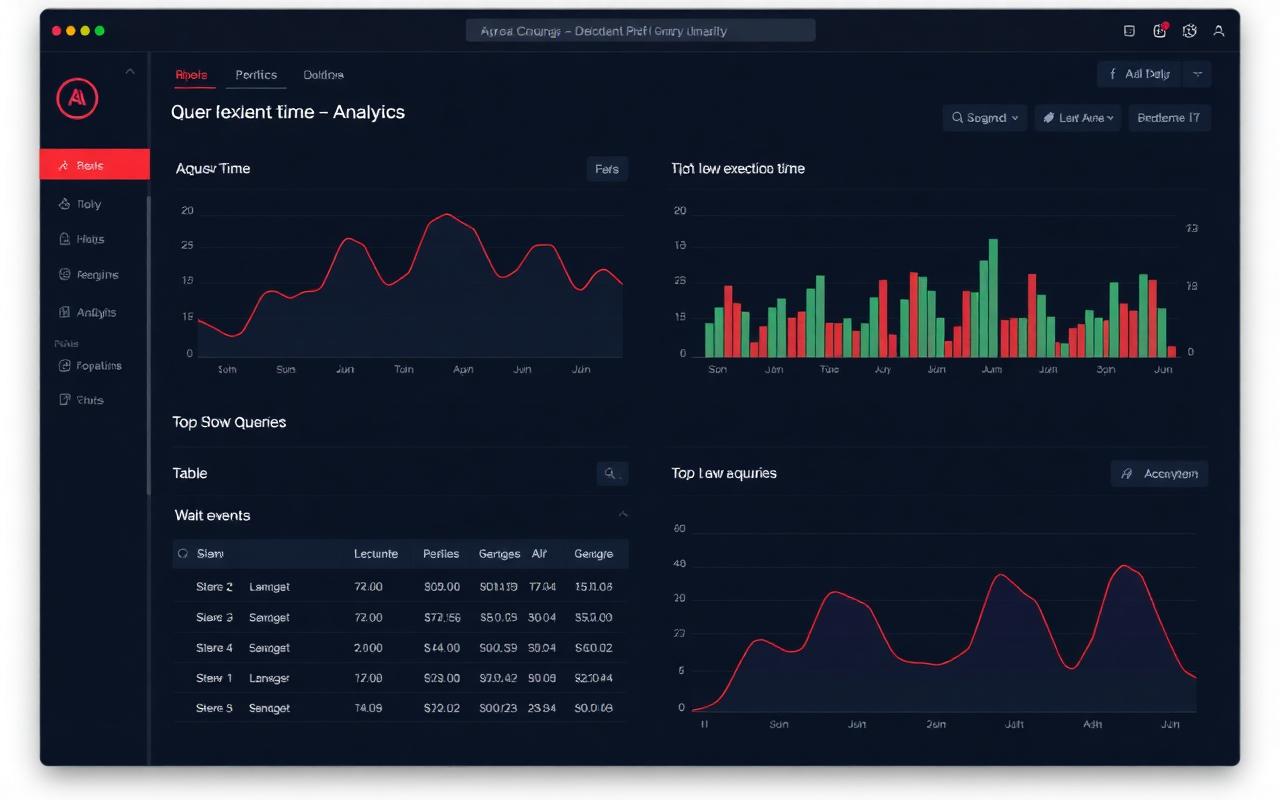
Query Analytics
Find & Fix Slow Queries Fast
Drill into top SQL by elapsed time, CPU, I/O, or buffer gets. View execution plans side-by-side across runs, spot regressions, and get tuning recommendations from our DBA-curated rules engine.
- Top-N query rankings with historical comparison
- Wait-event breakdown (CPU, I/O, locks, network)
- Index usage & missing-index suggestions
- Plan-change detection and regression alerts
Complete Coverage
200+ Metrics, Continuously Monitored
From low-level I/O to business-level SLA, ProactiveDB tracks every signal that matters across your database estate.
Performance
- CPU & memory usage
- Disk I/O & latency
- Buffer cache hit ratio
- Query execution time
Availability
- Instance uptime
- Listener status
- Cluster node health
- Failover events
Storage
- Tablespace usage
- Datafile growth
- Archive log space
- Temp segment usage
Replication
- Replication lag
- Standby sync status
- GoldenGate processes
- WAL shipping
Security
- Failed logins
- Privilege escalations
- Audit trail changes
- Account lockouts
Backups
- RMAN job status
- Backup duration
- Restore validation
- Retention compliance
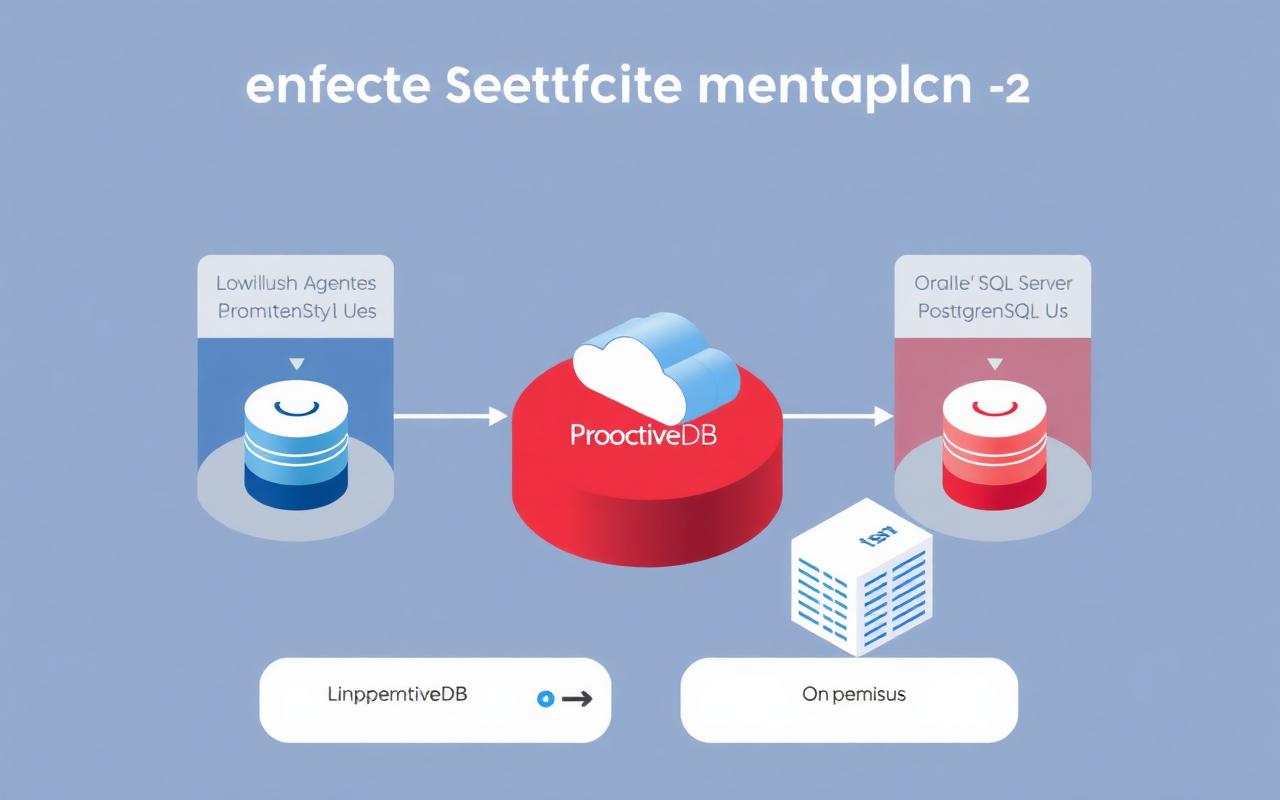
How It Works
Lightweight, Secure, Cloud-Ready Architecture
ProactiveDB uses agentless collectors that connect over standard database protocols and stream metrics to a central, hardened analytics hub. No production workload changes, no risky kernel modules — just deep visibility in minutes.
- Agentless deployment, < 30 min per database
- < 1% CPU overhead with read-only access
- SaaS or on-premise deployment options
- Encrypted in transit (TLS 1.3) & at rest (AES-256)
- SSO, SAML, RBAC and full audit logging
Use Cases
Built for Real-World DBA Challenges
Prevent Outages Before They Happen
Predictive alerts based on historical baselines warn you about tablespace exhaustion, runaway queries, and replication lag — hours before they cause downtime.
Reduce Mean Time To Resolve (MTTR)
Correlated metrics, root-cause hints, and contextual recommendations help your team fix issues 60% faster than traditional monitoring tools.
Meet SLA & Compliance Targets
Automated SLA dashboards and audit-ready reports for SOX, HIPAA, PCI-DSS, and GDPR keep your databases compliant without manual effort.
Optimize Cloud & Licensing Costs
Right-size your Oracle, RDS, and Azure SQL instances using detailed utilization trends and capacity-planning forecasts.
FAQ
Frequently Asked Questions
Which databases does ProactiveDB support?
ProactiveDB supports Oracle (11g–23c, RAC, Data Guard), Microsoft SQL Server (2012–2022, Always On), MySQL/MariaDB/Percona, PostgreSQL (10–16, Patroni), and managed cloud variants on AWS RDS, Azure SQL, and Google Cloud SQL.
How is ProactiveDB deployed?
We deploy lightweight, agentless collectors that connect via standard database protocols. Setup takes under 30 minutes per database and requires no changes to your production workloads. Both SaaS and on-premise deployments are available.
Does it impact database performance?
No. Our collectors use less than 1% CPU and rely on read-only views and DMVs. Polling intervals are fully configurable and can be tuned per environment.
Can I integrate it with my existing tools?
Yes. ProactiveDB integrates with Slack, Microsoft Teams, PagerDuty, ServiceNow, Jira, email, webhooks, Grafana, and Prometheus — so alerts and metrics flow into the tools your team already uses.
Is ProactiveDB included with Krizars DBA services?
Yes. All Krizars Remote DBA and Managed Services customers get ProactiveDB included at no additional cost. Stand-alone licenses are also available.
See ProactiveDB In Action
Schedule a personalized 30-minute demo and see how ProactiveDB can transform your database operations.
Request a Demo